
When I explain observability to developers, I sometimes like to start from a slightly unexpected place: Hearthstone.
In Hearthstone, a player does not only play cards and hope. They look at their starting hand, their deck, probabilities, cards already seen, likely cards in the opponent’s hand, meta statistics and replays of their mistakes.
The best players do not win because they have access to a magical truth. They win because they turn a confusing game into an observable system.
And that is exactly what we try to do with an application in production.
Playing without a tracker is debugging without signal
Without a tracker, a Hearthstone game relies on memory and intuition.
You can count cards by hand. You can roughly remember what has been played. You can feel that a matchup is unfavorable. But the longer the game goes on, the more the brain tires and the blurrier decisions become.
Production is the same.
Without logs, metrics, traces and well-placed events, we end up reasoning from symptoms. A user says “it is slow”. A team says “payment is unstable”. An alert says “something is above a threshold”. And everyone tries to reconstruct the game after the fact.
The tracker does not play for us. Observability does not either. But both reduce the fog.
The mulligan looks like a dashboard
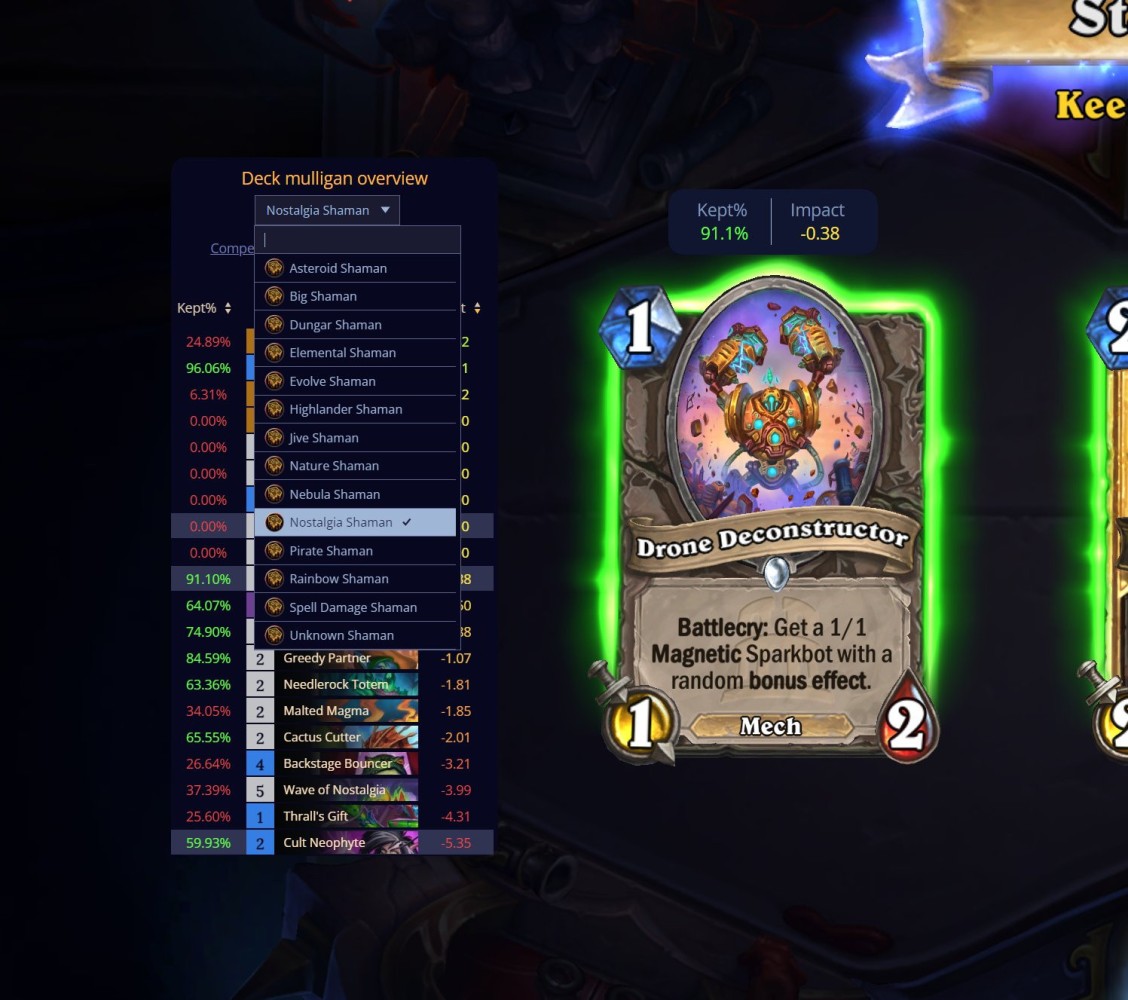
In Hearthstone, the mulligan is a critical moment. You choose which cards to keep in your starting hand. A bad decision can doom the game before it has really started.
Tools like Firestone or HSReplay provide win-rate statistics depending on which cards are kept or exchanged. It is not absolute truth, but it is a signal.
The data does not say “do this”. It says: “in comparable situations, here is what worked better”.
A good observability dashboard should produce the same effect. It should not replace the engineer’s judgment. It should provide enough context to avoid deciding in the dark.
If an API route has a higher error rate after a deployment, if an external dependency increases its latency, if a service consumes more memory after a release, we do not want graphical decoration. We want decision support.
The deck tracker as an execution log
A deck tracker follows played cards, remaining cards and important events in the game.
That looks a lot like an execution log.
When an application receives a request, calls three services, writes to a database, publishes a message and answers the user, it is also playing a sequence. If we do not trace it, we only see the final result.
The log tells us what happened at one precise place.
The metric tells us how a behavior evolves over time.
The trace tells us how a request crosses the system.
The deck tracker is not a perfect equivalent of these three signals, but the intuition is good: making visible a sequence that a human cannot perfectly follow in real time.
The meta is production
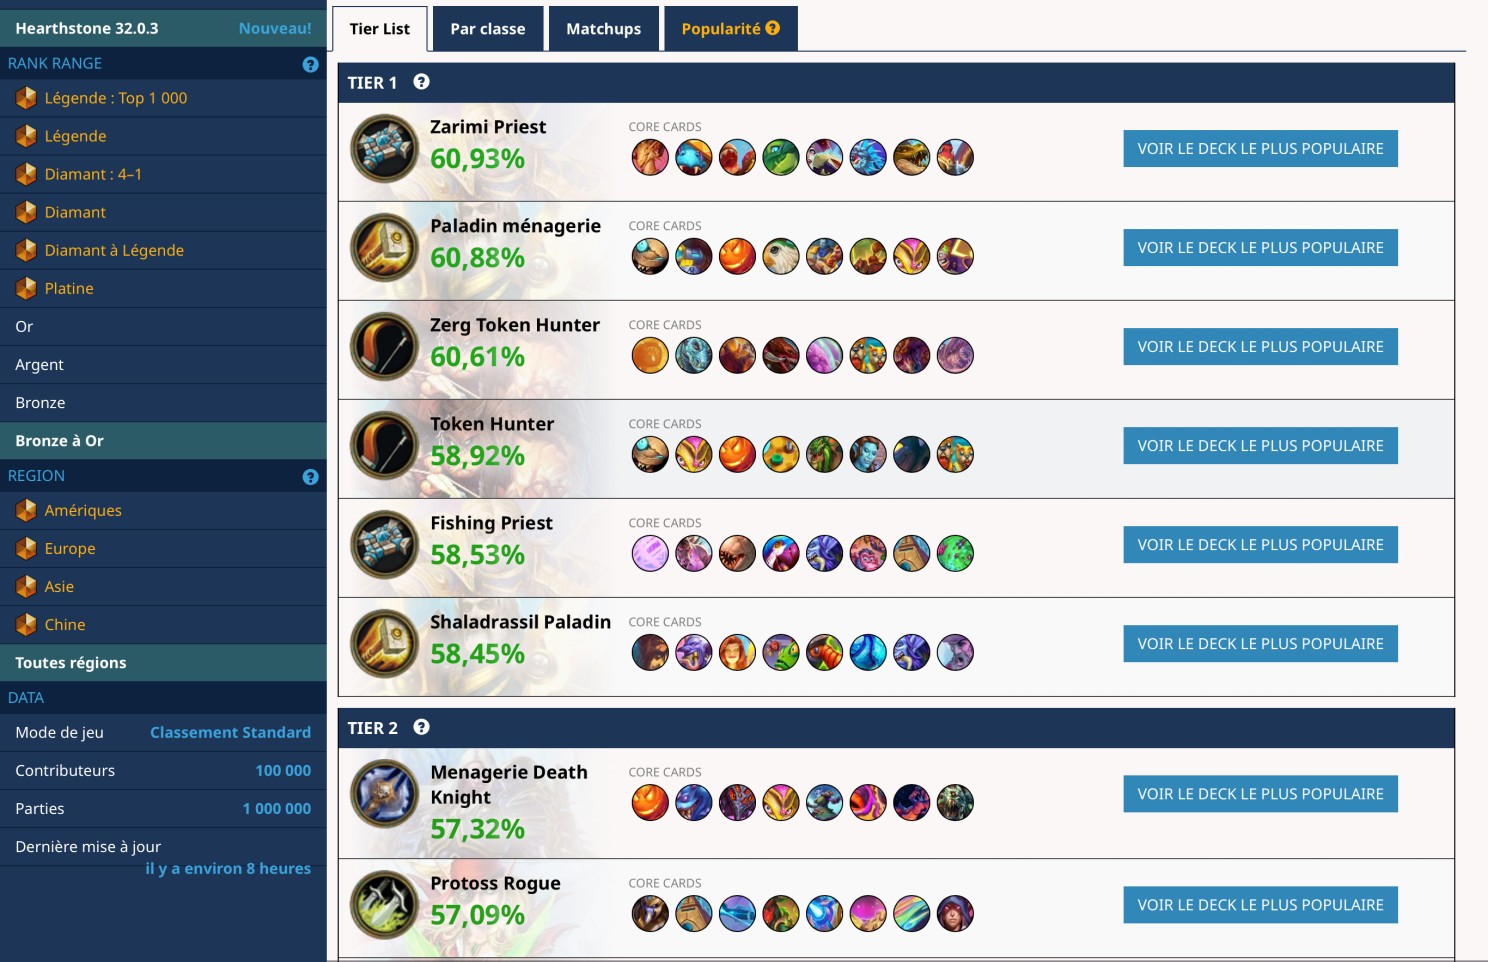
Hearthstone statistics sites do not look only at one game. They aggregate thousands or millions of games to understand the meta.
Which deck wins against which other deck? Which card increases win rate? Which list becomes popular? Which strategy disappears?
In production, we have the same difference between local signal and global signal.
A trace helps us understand one request. An aggregated metric helps us understand a trend. A global dashboard helps us see whether the system is changing regime.
The dangerous part is confusing levels.
A slow request is not necessarily an incident. A stable average can hide a broken user segment. A rare error can be normal, or announce a serious regression if it touches the right journey.
Like in a competitive game, you need to know how to move from replay to meta.
Too much data can hurt decisions
A bad tracker can distract. Too many numbers, too many panels, too many recommendations, and the player loses the thread of the game.
Observability suffers from the same trap.
We can collect enormous amounts of logs without knowing what to do with them. We can create hundreds of metrics that answer no question. We can trace every call and never look at traces because nobody knows where to start.
The right question is not “how much data do we have?”
The right question is: “what decision does this data help us make?”
A dashboard that never changes a decision is a poster. An alert that triggers no reliable action is noise. A trace nobody can connect to an incident is an archive.
A replay is sometimes better than a graph
In Hearthstone, watching a game again helps understand a mistake that statistics alone do not show.
The win rate may say a card is strong. The replay shows the turn where it was misused.
In production, a detailed trace often plays this role. It shows the exact chain: service A waits for service B, which waits for a database, which suffers contention, while a retry amplifies load.
The metric shows the smoke. The trace shows the path of the fire.
Both are necessary. A system with only aggregates can miss the real scenario. A system with only individual traces can miss the global trend.
Autobattlers and distributed systems
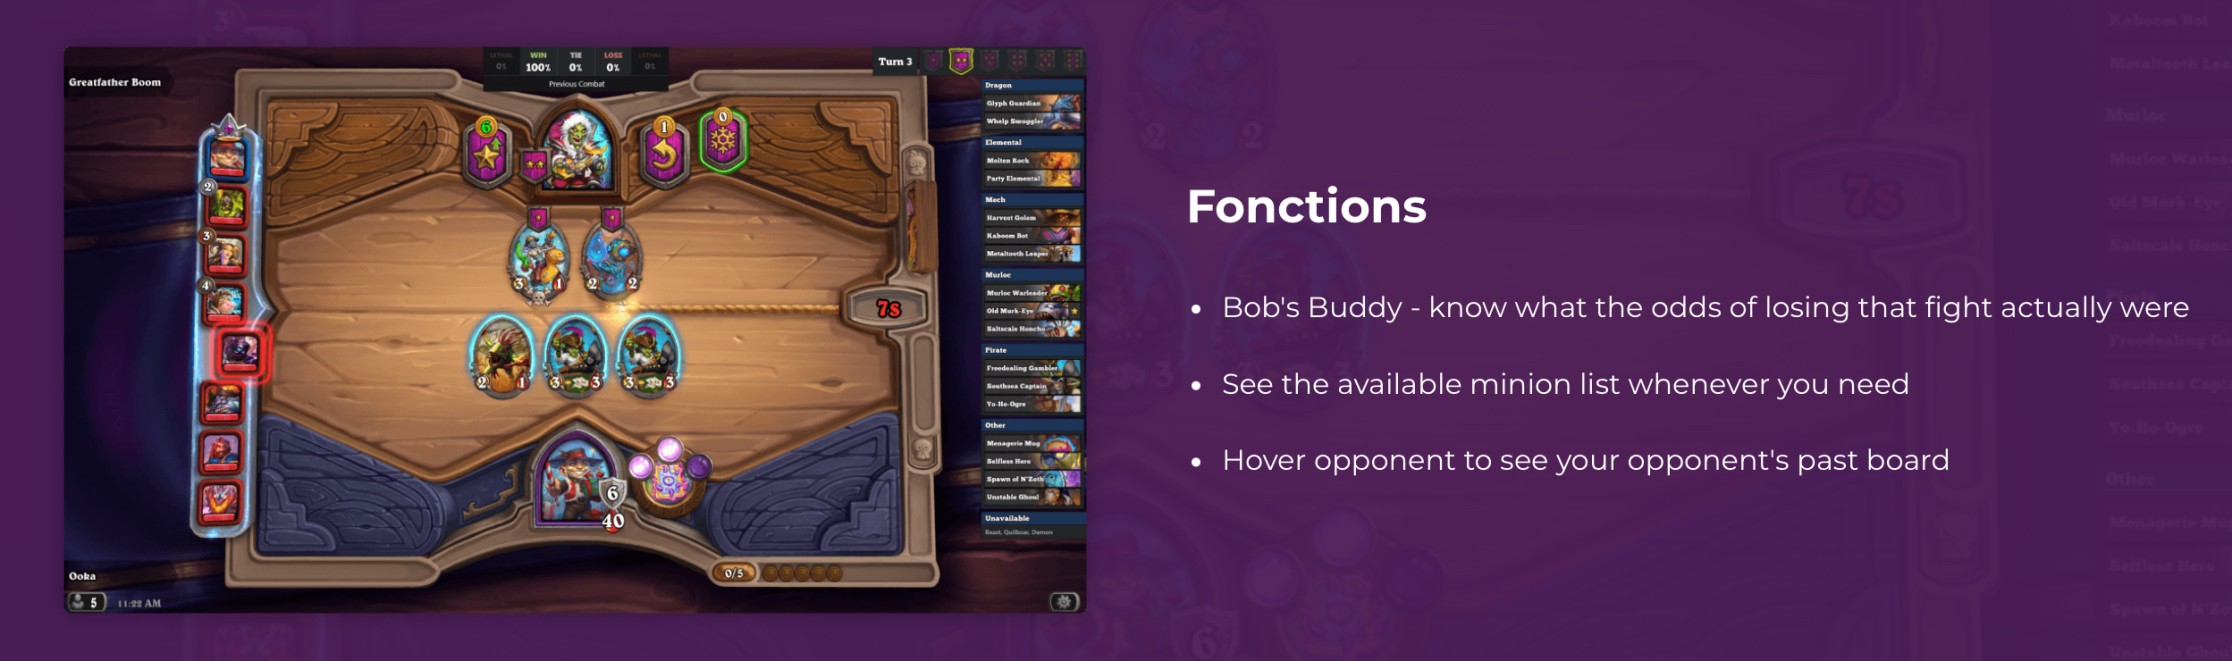
In Battlegrounds, trackers also help understand a game mode where many things happen automatically.
The player prepares a composition, but the fight itself unfolds according to rules, effects, probabilities and interactions that are sometimes hard to anticipate.
That looks strangely like our distributed systems.
We configure, deploy, size and write code. Then the system lives. Queues fill, caches empty, timeouts stack up, dependencies slow down, retries synchronize, clients change behavior.
Observability helps us understand what happens when the system plays by itself.
The right signal arrives at the right time
A useful tracker does not show everything with the same importance. It highlights what helps during the game.
How many cards remain in the deck. Which card was generated. Which option has a better history. Which opponent comes next. Which information deserves attention now.
For observability, it is the same.
During an incident, we do not want to explore all telemetry in the company. We want to answer concrete questions quickly.
What changed?
Which users are affected?
Which application path is affected?
Does the problem come from code, infrastructure, a dependency or a traffic change?
Is it getting worse?
Can we roll back?
The quality of observability is measured a lot in those minutes.
The developer remains the player
The important point is that the tracker does not replace the player.
It does not have the full context. It does not always understand the plan. It can suggest a statistically good line that is bad in one precise situation.
Observability does not replace the engineer either.
It gives signals, correlations, timelines and distributions. It helps formulate hypotheses. It accelerates the investigation. But it does not decide alone on architecture, rollback or product trade-off.
The goal is not to automate judgment. The goal is to give it better eyes.
Why I like this analogy
I like this analogy because it makes observability less abstract.
Developers quickly understand that a tracker is not a collection of numbers for decoration. It is a tool that turns a dynamic situation into usable information.
We find the same tensions: too much data, not enough context, bad timing, bad granularity, confusion between correlation and causality, indicators useful for beginners but insufficient for experts.
And above all, we understand that a good tool does not only provide more information. It gives a better reading of the game.
Observability does not wait
In a game, you can sometimes afford to lose a match to learn.
In production, the game costs more.
When a critical system goes down, when a payment fails, when an API becomes unstable or when a queue explodes, nobody wants to start instrumenting after the fact.
Observability must be thought through before the incident. Like a tracker you install before launching the game.
Not to know everything. To have enough signal at the moment when a decision is needed.
Observability does not wait.